The rapid rise of One Nation in Victoria
One Nation won just under 6 per cent of the Victorian vote at the 2025 federal election. Ahead of the state election on 28 November it is polling about four times that, enough to give it the highest first-preference vote in 14 of the 88 electorates.
The rise
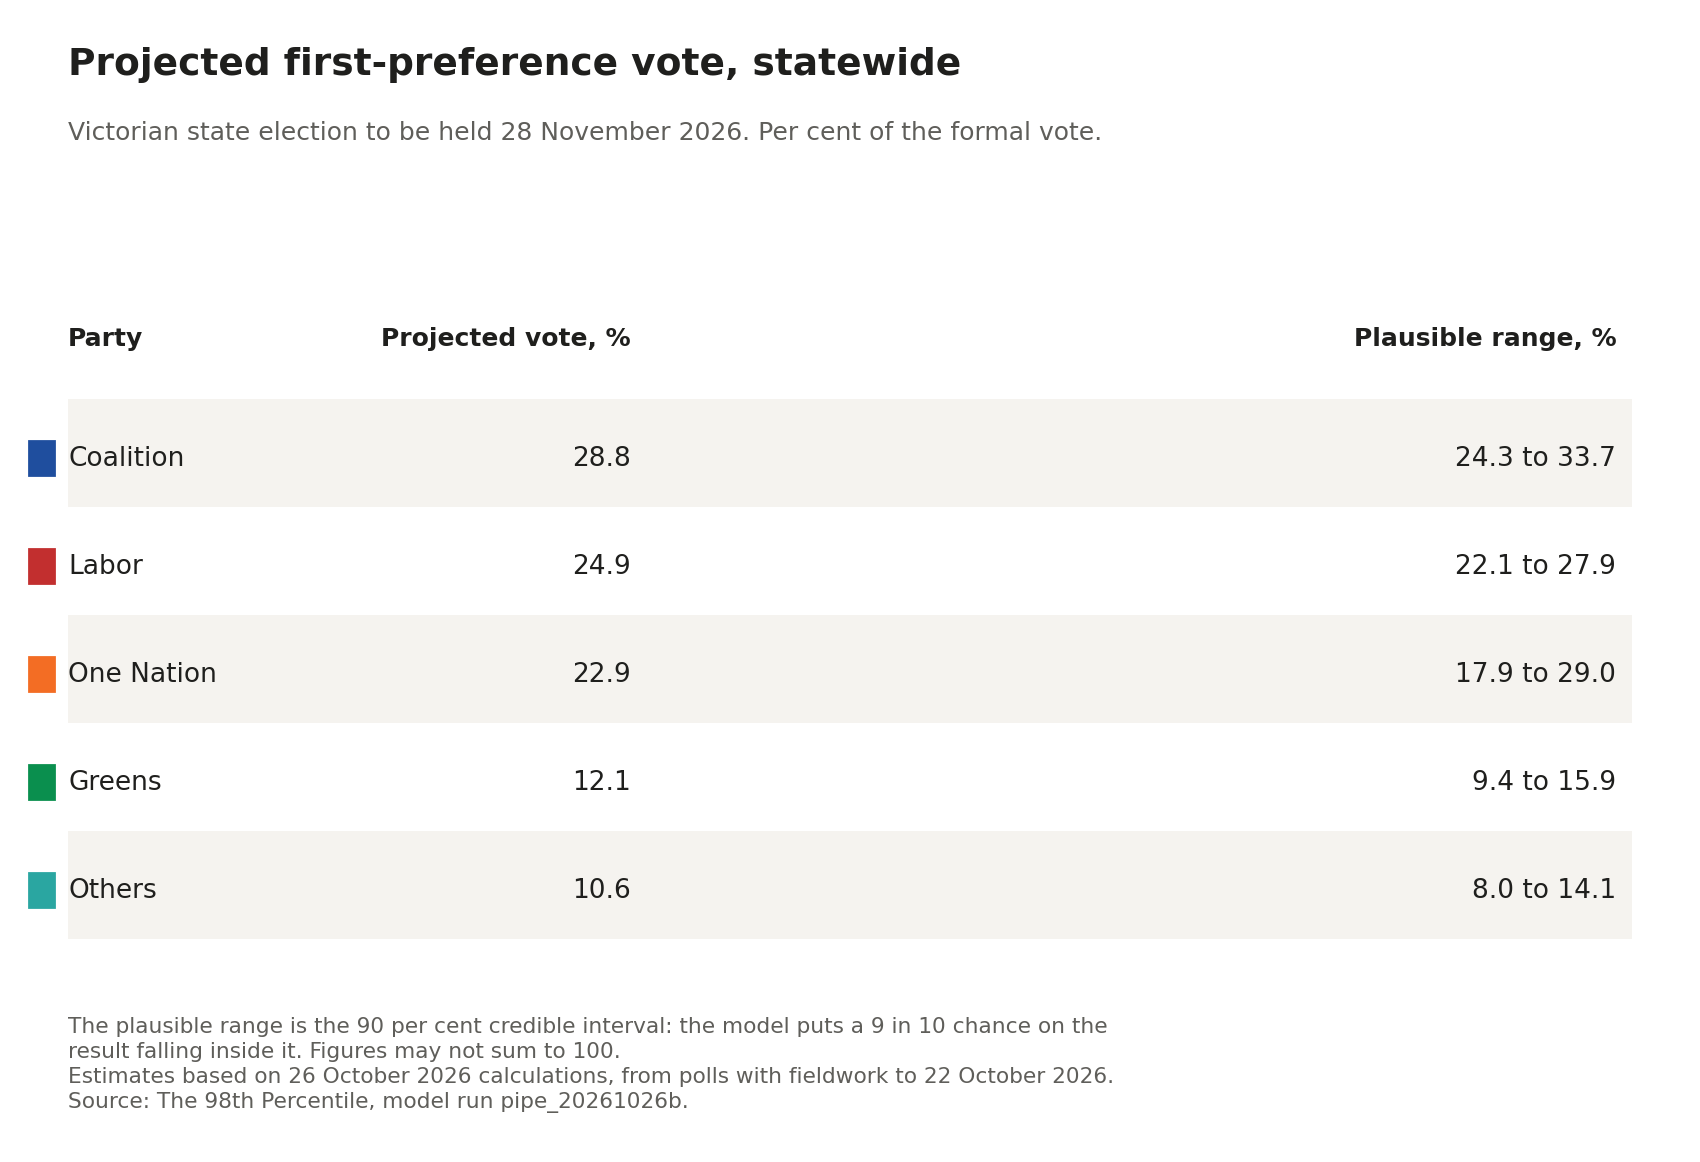
At the federal election in May 2025, One Nation won just under 6 per cent of the first-preference vote in Victoria’s House of Representatives seats. At the 2022 Victorian state election it was a marginal presence, standing candidates in only five of the 88 electorates. On current polling, its first-preference vote at the election on 28 November is estimated at 22.9 per cent, with a plausible range of 18 to 29. The same model puts the Coalition on 28.8 per cent, Labor on 24.9 and the Greens on 12.1. The Coalition leads on these figures. Labor sits 3.9 points behind it, and One Nation a further 2.0 points back. Three parties sit inside six points.
For scale, the closest Victorian comparison is the 1955 Labor split, when the breakaway Australian Labor Party (Anti-Communist), later the Democratic Labor Party, won 12.6 per cent of the vote. One Nation is now polling at about twice that level.
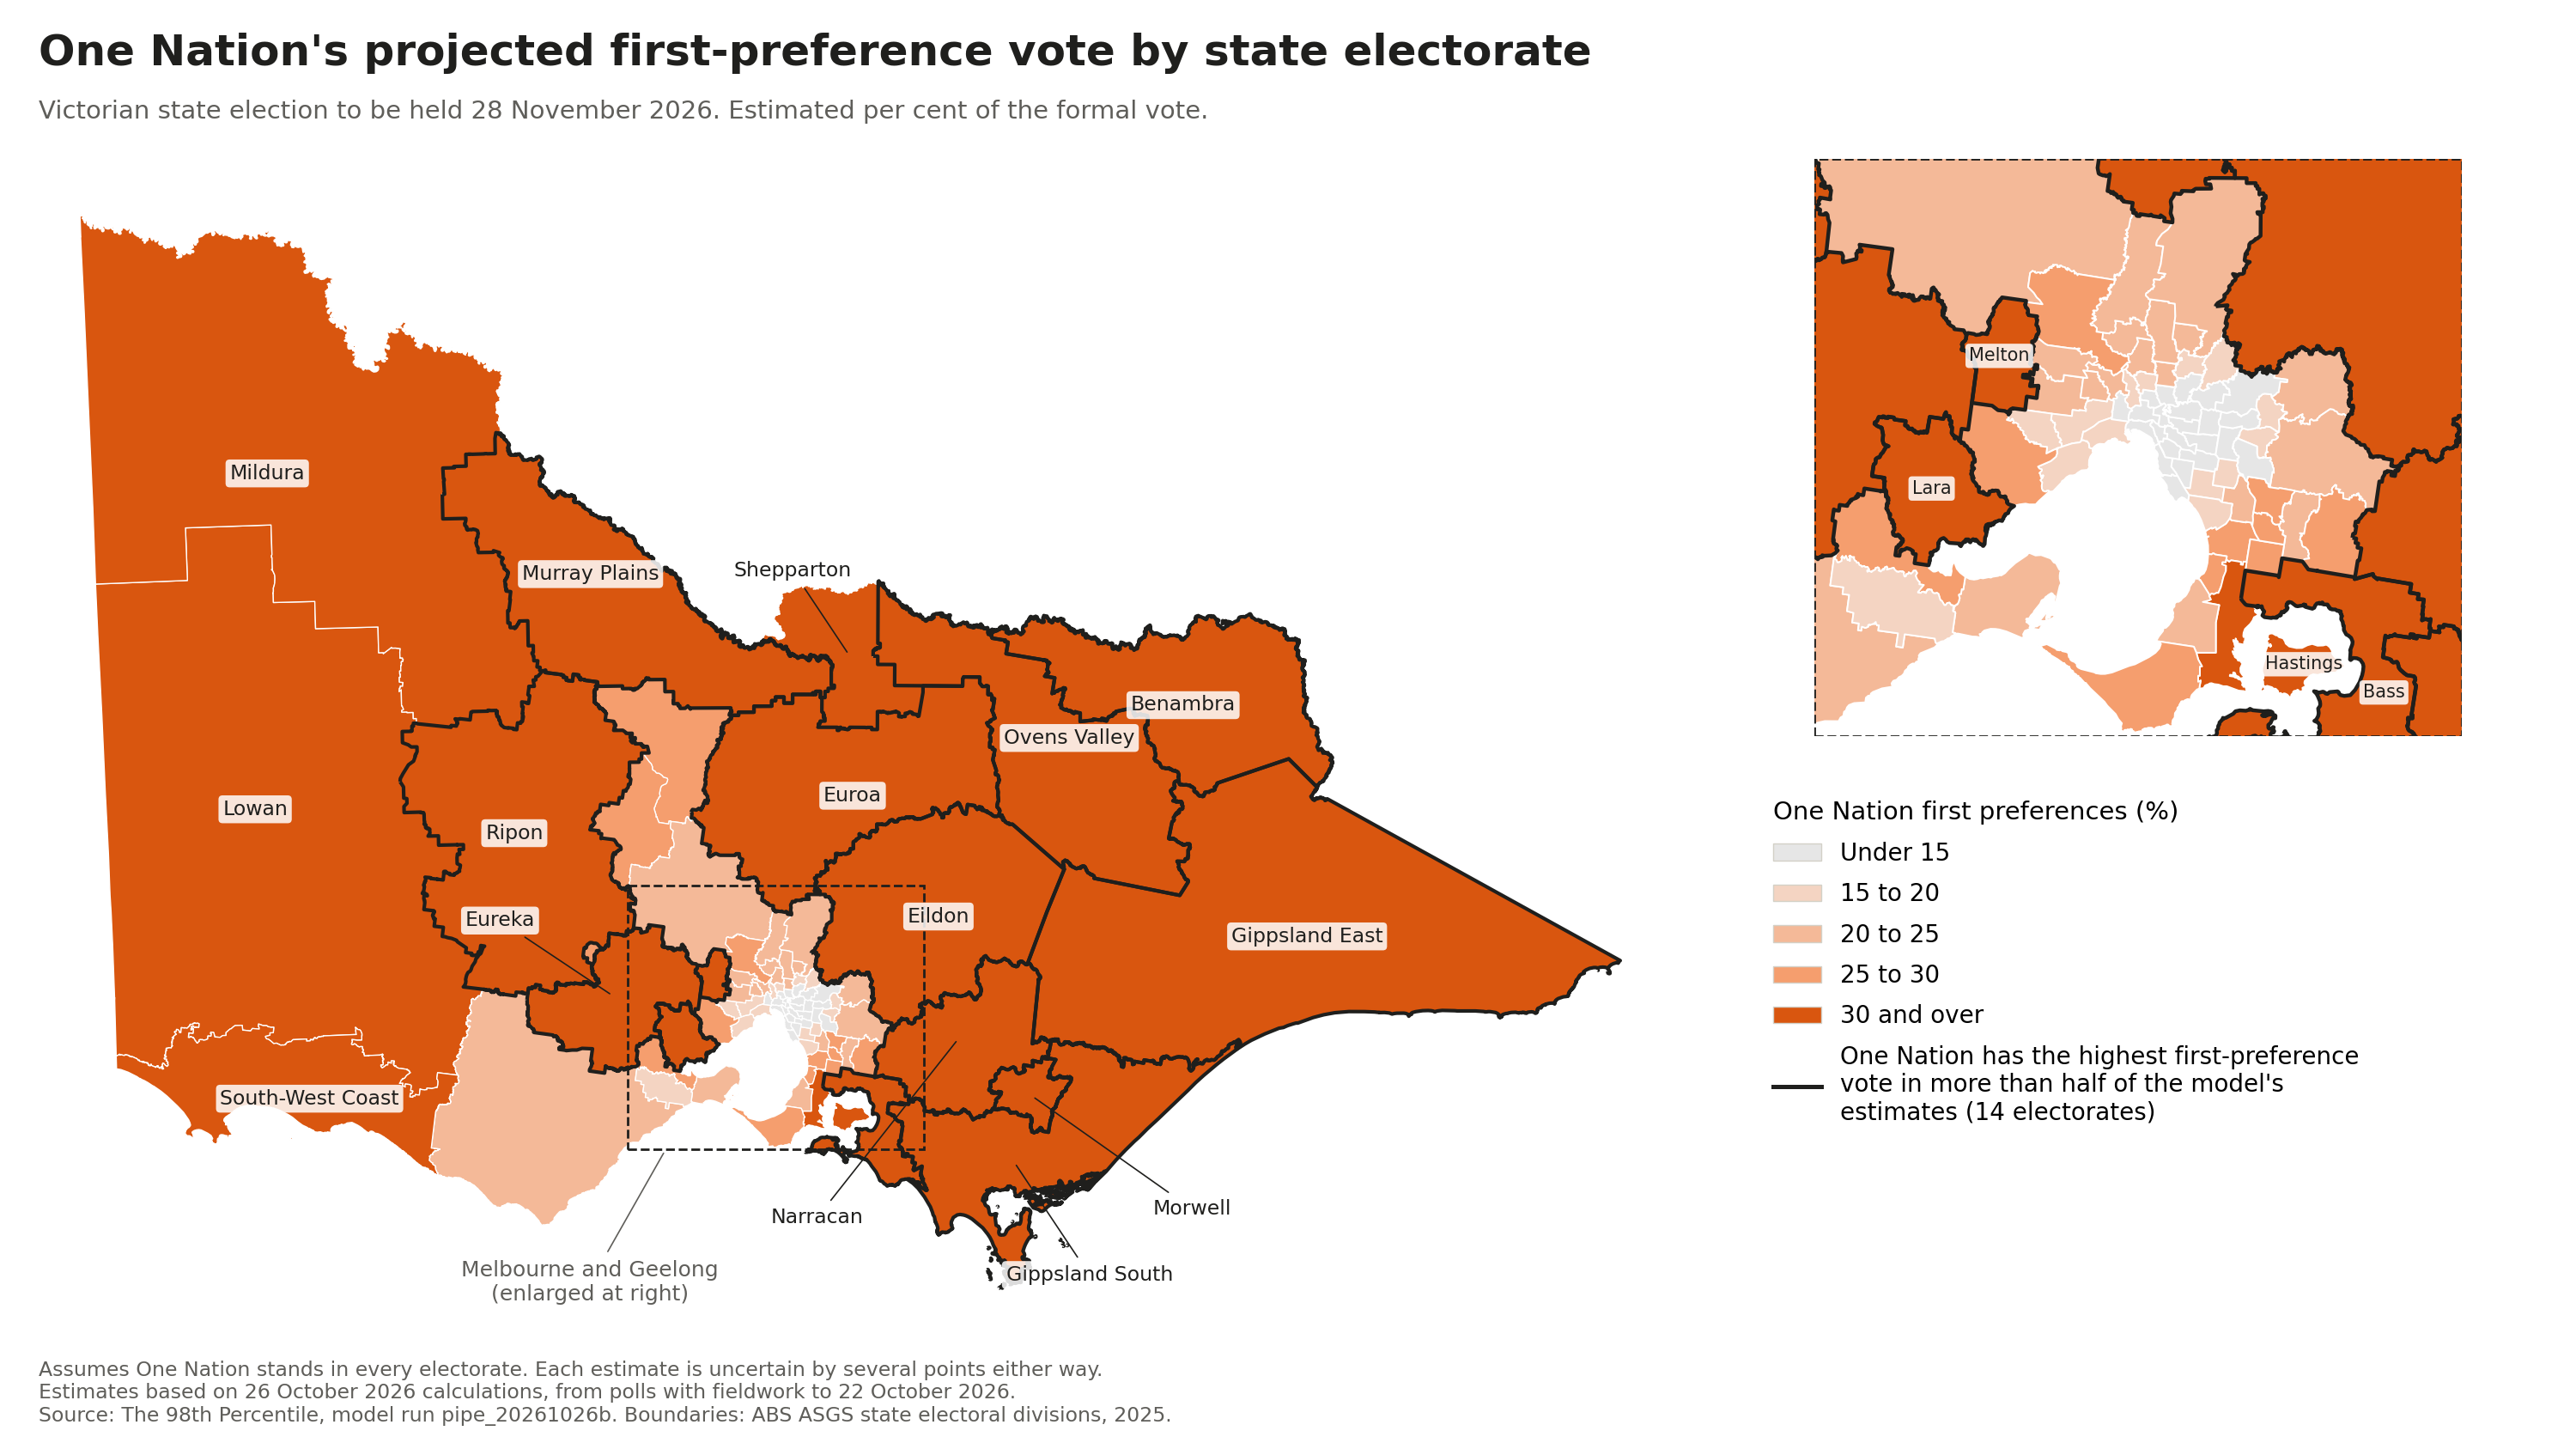
The projected vote crosses party lines. In Lara, a safe Labor seat on Geelong’s northern edge, One Nation is projected at 37 per cent with Labor second on 26. Across the Nationals’ safest country seats, Murray Plains, Gippsland East and Gippsland South, One Nation leads the projected count. And in Morwell, projected at 47 per cent, winning more than half the first-preference vote outright sits inside the plausible range. One Nation has a better than even chance of the highest first-preference vote in 14 of the 88 electorates, outlined on the map and listed in the table at the end of this article.
How the estimates are made
The 98th Percentile forecasts the election in three stages. The first combines all the published state polls into a statewide estimate for each party, correcting for each polling company’s known lean. The second works out where that statewide vote falls across the 88 electorates. The third stage, still to come, simulates the flow of preferences to decide who wins each electorate.
One Nation is the hardest party in the model, because there is no past Victorian election to learn from. The 2026 South Australian election fills the gap. One Nation surged there from 2.6 per cent in 2022 to 22.9 per cent, the only recent state election to see a rise of the size Victoria’s polls now show. The model borrows two lessons from it, on the assumption that Victorian voters and pollsters will behave much as South Australia’s did.
The first lesson is that the online polls read the surge accurately. The four final online polls in South Australia put One Nation at 21 to 23 per cent against a result of 22.9, and two of those pollsters, Newspoll and DemosAU, are also polling Victoria. Roy Morgan’s SMS poll, taken a month before polling day, overstated One Nation by about five points, and the model allows for that. The second lesson is where the vote sits. In South Australia, One Nation was strongest in less affluent electorates, in the country and in Adelaide’s outer northern suburbs, and weakest in affluent inner Adelaide. The Victorian model applies that pattern through each electorate’s education profile from the Census, alongside its 2025 federal vote. An earlier, simpler version of the method was tested on South Australia, where it reproduced each electorate’s One Nation vote to within 1.7 percentage points on average. The current model builds on that version, and its first full test will be the Victorian result itself.
All of this rests on a single election, and the assumption that Victoria will behave like South Australia cannot be tested until Victoria votes. That is why the estimates carry wide plausible ranges. Every figure here is published with its range and its method, so a reader can check it rather than take it on trust. The full method is set out on the Methodology page.
How these estimates compare with other published work
Two other published analyses bear on these figures.
Antony Green has mapped One Nation’s 2025 federal vote onto Victoria’s state electorates. He offers a rule of thumb rather than a projection: statewide polling is now three to four times the 2025 level, so an electorate at 8 to 10 per cent federally might see 25 to 35 per cent at the state election. Where One Nation was already strong, the model agrees with him closely. It implies three times the federal vote in Morwell, 3.2 times in Lara and 3.3 times in Gippsland East. The two part company where One Nation polled poorly. The model implies seven times the federal vote in Hawthorn and almost five times in Broadmeadows. A single multiplier cannot hold at both ends, because a party moving from 1 to 8 per cent has multiplied its vote sevenfold while travelling a far shorter distance than one moving from 16 to 47. The model works on a scale that handles this. Agreement with Green across the strong electorates is independent corroboration of the geography from the most experienced reading of it available.
The second is a seat-by-seat estimate by Redbridge and Accent for Victorian Trades Hall, reported by Ben Raue at The Tally Room. It uses a technique called MRP, which models every electorate’s vote from one large survey, and it carries primary votes for all 88 electorates. It puts One Nation on 27 per cent statewide, four points above the estimate here. That difference is unremarkable. The model here pools every published poll and corrects for each company’s lean, where an MRP rests on a single survey. The more interesting divergence comes after the primaries. The MRP’s own seat count gives One Nation 12 seats. Raue, applying his own preference estimates to the same primary votes, gets 27. That gap is entirely about how preferences flow and which two candidates reach the final count. It is the question the third stage of this model is built to answer, and it will be addressed once the how-to-vote cards are registered.
The 14 electorates where One Nation has a better than even chance of leading
These are estimates of the first-preference vote only. They are not predictions of who will win each electorate. Victorian elections are decided on preferences, and preferences cannot be modelled until the parties’ how-to-vote cards are registered, about two weeks before election day. Victory forecasts will be published then.
The table below lists the 14 electorates, with One Nation’s projected share, its plausible range, the party with the next-highest vote and the party that currently holds the seat. Of the 14, five are held by Labor, six by the Nationals and three by the Liberals. The figures assume One Nation stands a candidate in every electorate, and take no account of who those candidates are. One Nation’s leader Warren Pickering is contesting Pakenham, which these estimates do not reflect. Across the state its projected vote runs from 8 per cent in Hawthorn to 47 in Morwell; the full estimates for every party in every electorate are published as data.
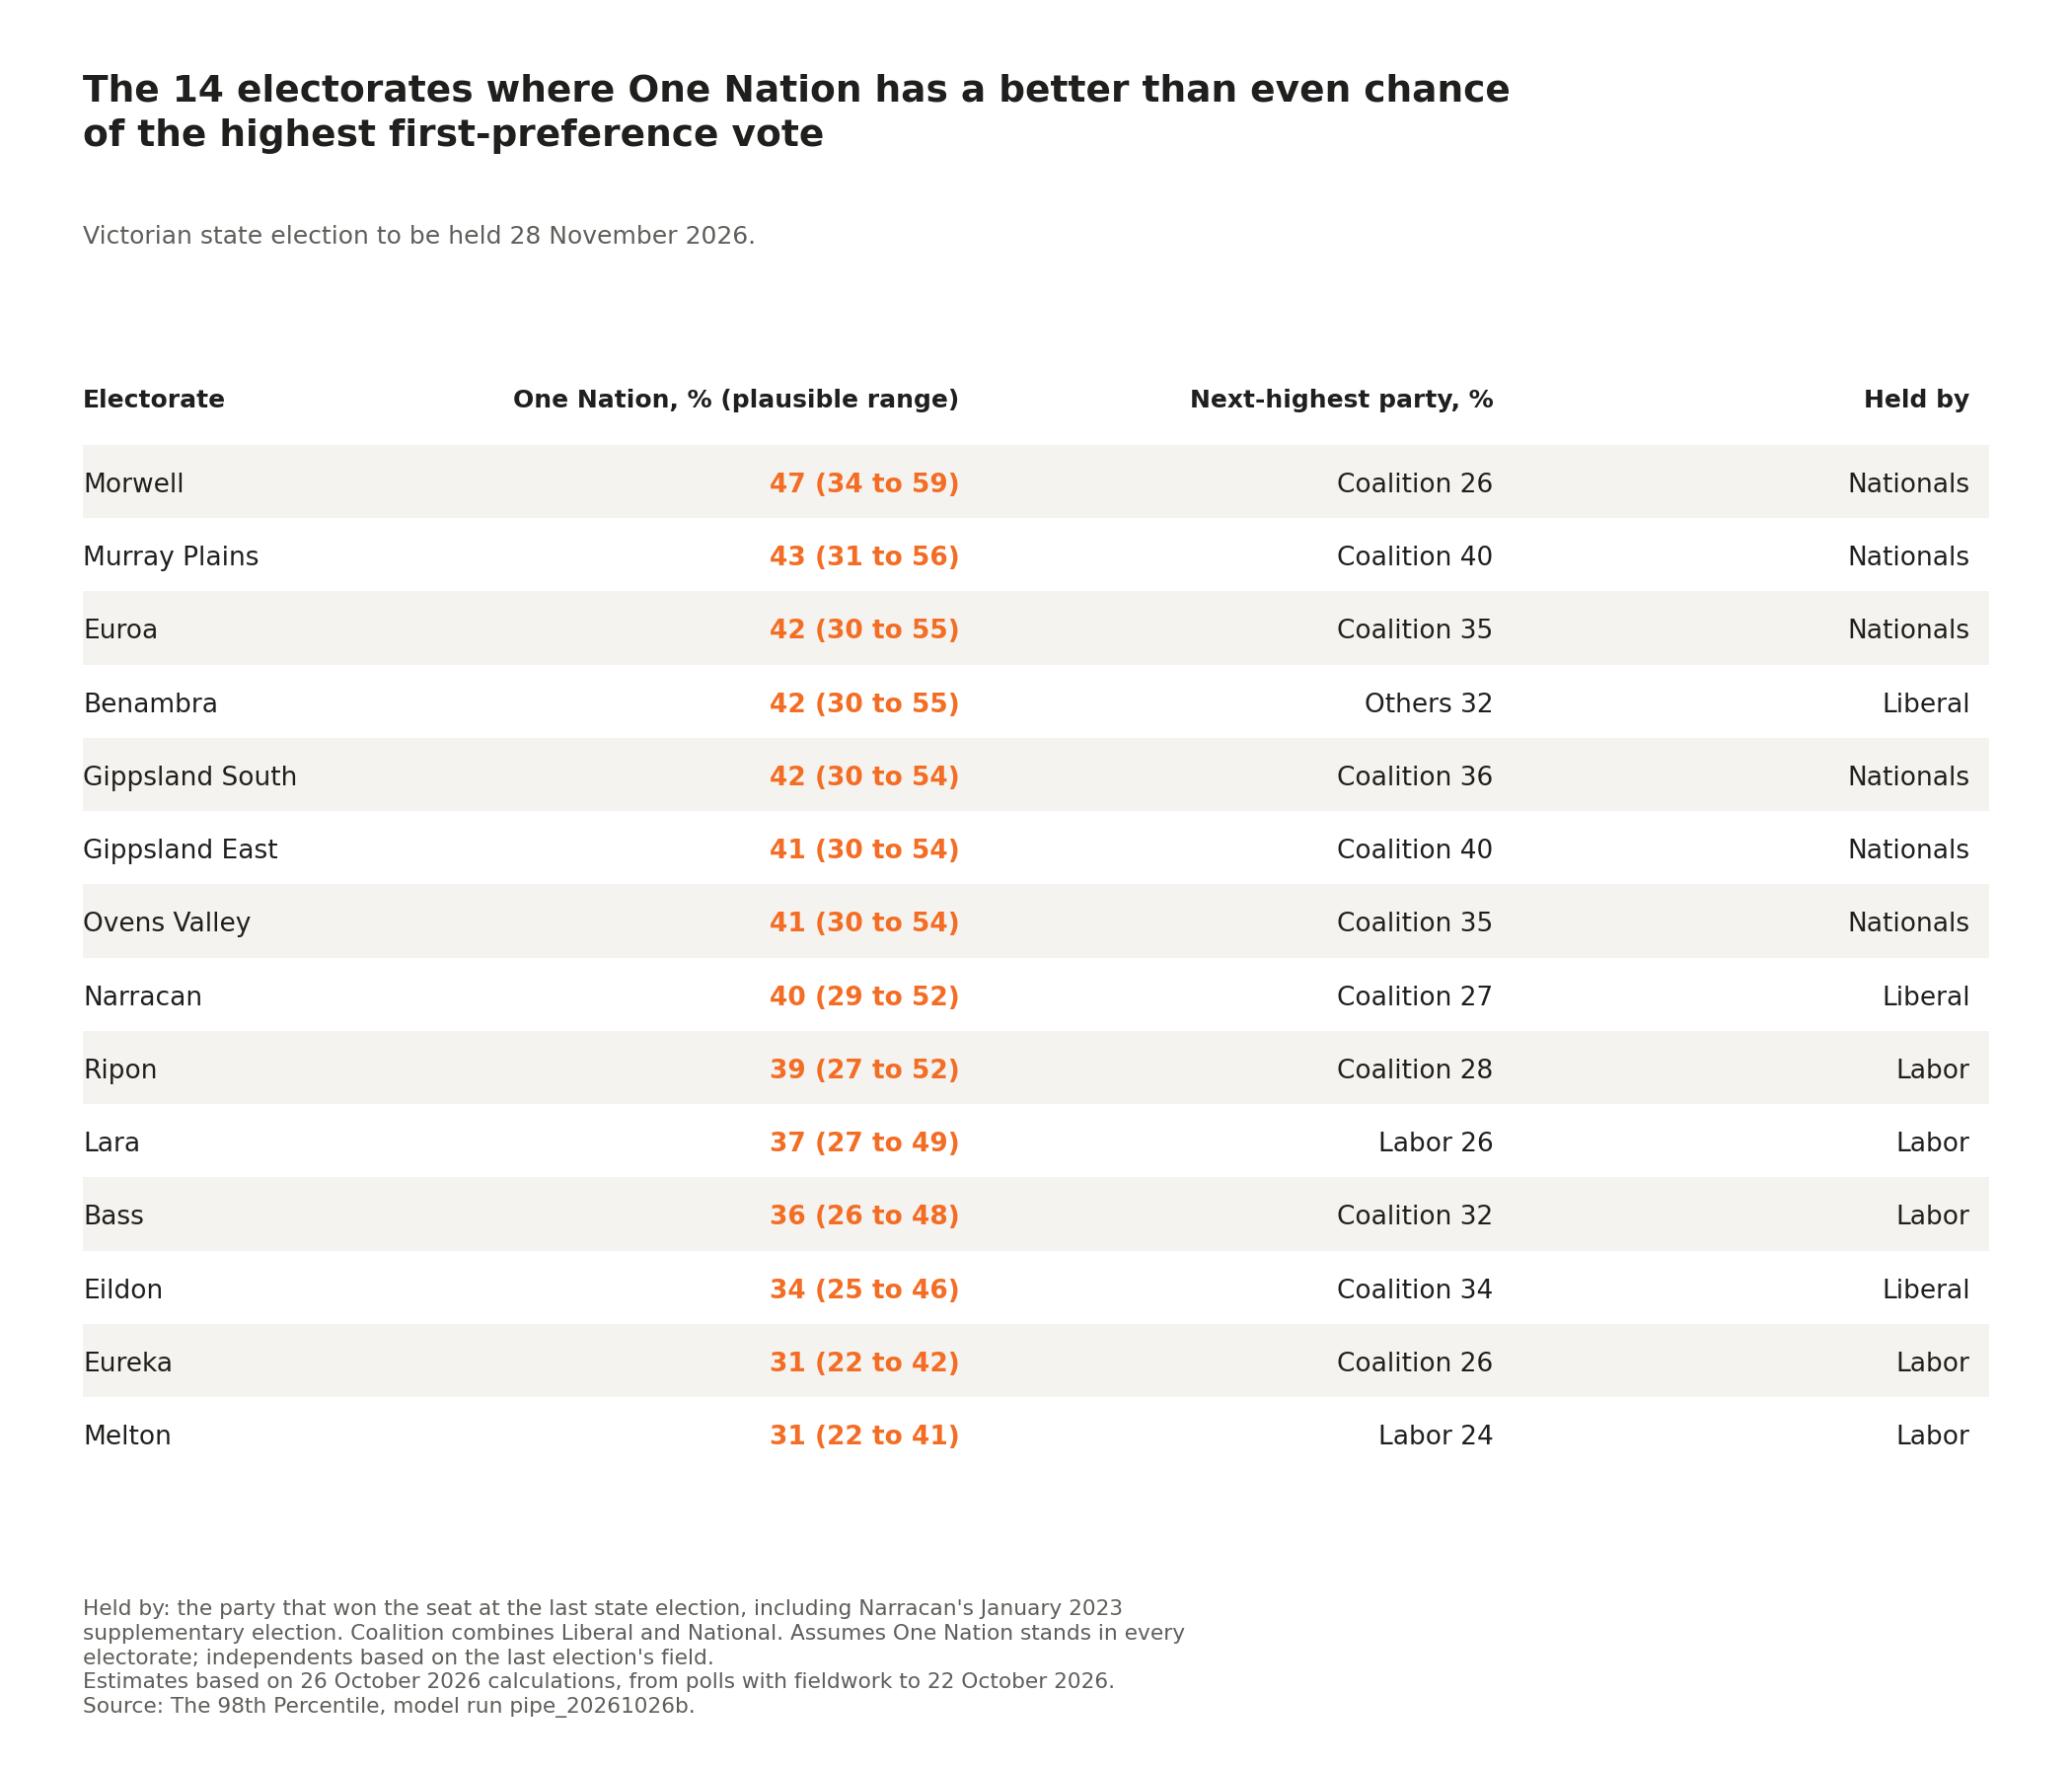
Estimates from the 98th Percentile model run of 26 October 2026 (run pipe_20261026b), on published Victorian state polls with fieldwork to 22 October 2026. Method and data sources: the Methodology page. Boundaries: ABS ASGS 2025 state electoral divisions. Results data: Victorian Electoral Commission; federal results: Australian Electoral Commission; census: ABS 2021.
Use of AI
I used large language models, Anthropic’s Claude Opus 5.5 and Claude Fable 5, to test this work for narrative flow, logical consistency, bias and errors. They also assisted with drafting and with the site’s code. Responsibility for the content is mine alone.
John Ward (The 98th Percentile)
Copyright
Citation
@online{ward_(the_98th_percentile)2026,
  author = {Ward (The 98th Percentile), John},
  publisher = {The 98th Percentile},
  title = {The Rapid Rise of {One} {Nation} in {Victoria}},
  date = {2026-10-28},
  url = {https://the98thpercentile.pages.dev/analysis/one-nation-first-preferences.html},
  langid = {en-AU}
}